

How electricity pricing is structured
When your utility delivers electricity, it charges you based on a rate structure, a formula that converts your consumption into a dollar amount. Most U.S. residential customers are automatically enrolled in one structure, but many utilities offer at least one alternative. Understanding the three most common structures helps you decide whether to stay on your current plan or ask about switching.
Electricity consumption is measured in kilowatt-hours (kWh). One kWh is the energy used by a 1,000-watt appliance running for one hour. Your rate structure determines what you pay for each kWh and whether that price changes based on volume or timing.
Flat-rate plans
A flat-rate plan charges the same price per kWh for every unit you use, at any time of day or night, all month long. If your rate is 13 cents per kWh and you use 900 kWh, your energy charge is $117, with no adjustment for when that energy was consumed.
The appeal is predictability. Your bill rises and falls with total consumption, and there are no thresholds to track or hours to avoid. This structure works well for households with steady, moderate usage and those who cannot easily shift when they run large appliances.
The drawback is that flat rates do not reward efficient or off-peak behavior. A household that runs its dishwasher at midnight pays the same rate as one that runs it at peak demand on a summer afternoon.
Tiered pricing plans
Tiered pricing (also called inclining block rates) divides your monthly usage into bands. The first block of kWh, say the first 500, carries a lower base rate. Any usage above that threshold moves into a second tier at a higher rate per kWh. Some utilities add a third tier for very high usage.
The structure is designed to keep bills low for light users while charging heavier users progressively more. A household that stays within the first tier all month benefits from the lower rate. One that regularly exceeds the threshold pays more per unit on the excess.
Tier thresholds and the price difference between tiers vary by utility and sometimes by season. In some California and Southwest utilities, the gap between the lowest and highest tier can be significant, so knowing your average monthly kWh helps you gauge where you typically land.
Time-of-use plans
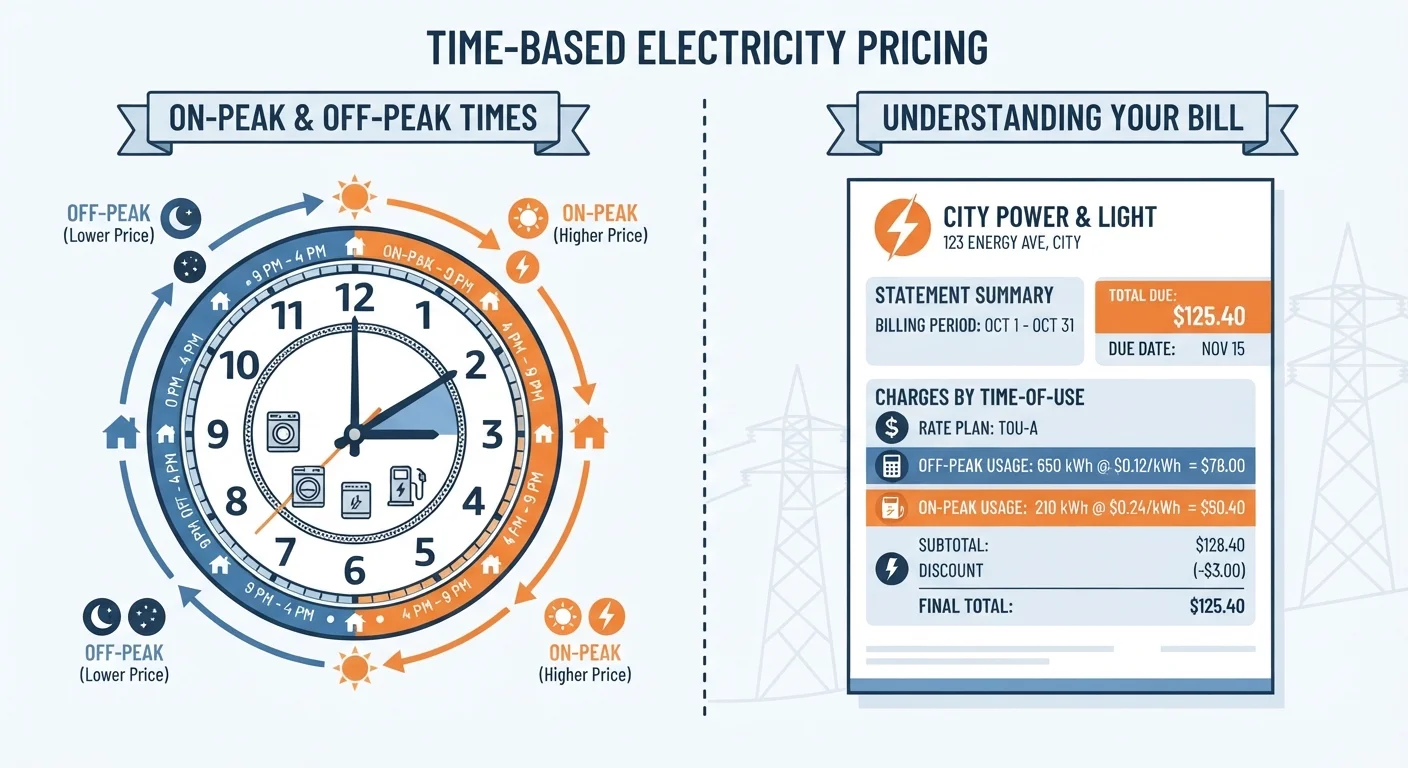
Time-of-use (TOU) plans set different rates for different periods of the day, typically a lower off-peak rate and a higher on-peak rate. Peak windows often fall on weekday afternoons and evenings when overall grid demand is highest. Off-peak periods cover nights, early mornings, and usually weekends.
A household enrolled in TOU pays less for energy used during off-peak hours and more for energy used during peak windows. Running a clothes dryer at 9 p.m. instead of 5 p.m. could cost meaningfully less, depending on the spread between the two rates.
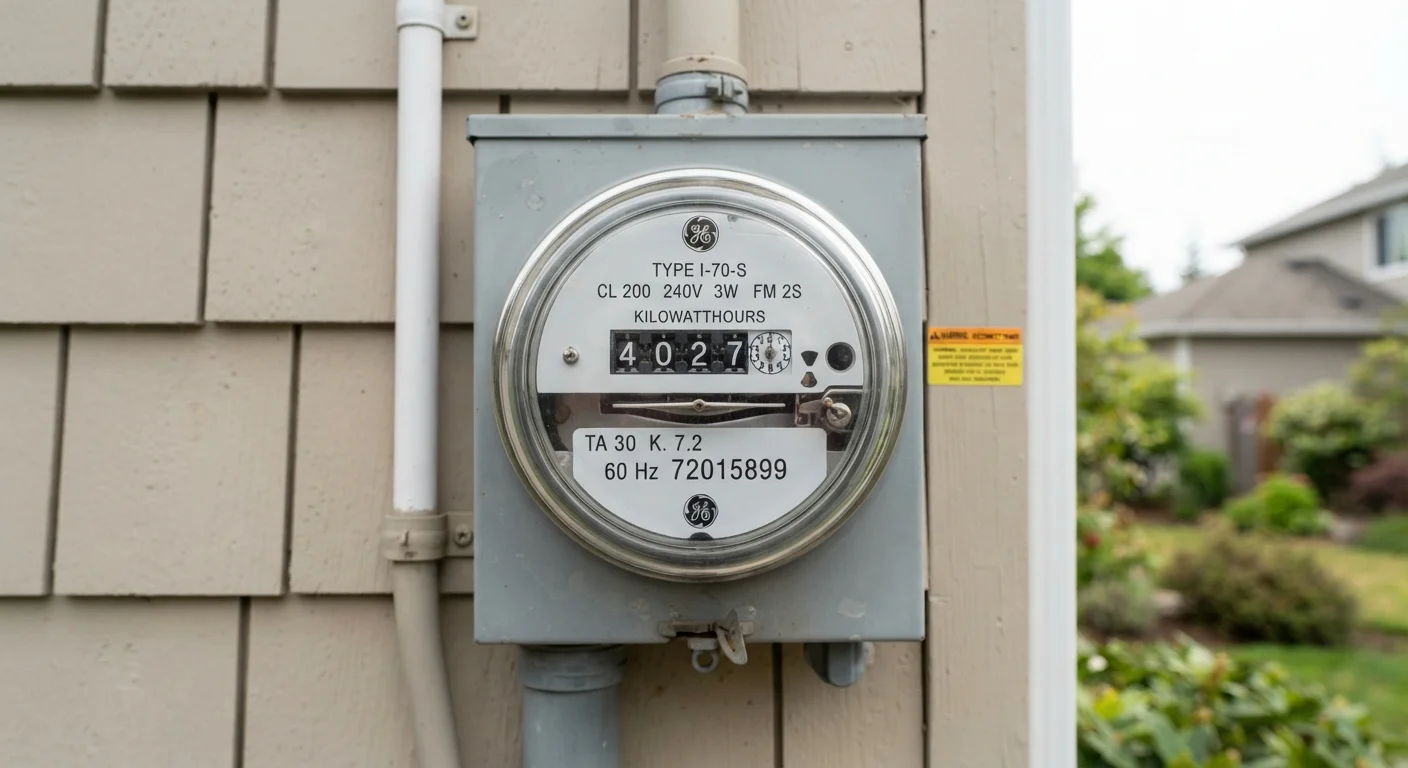
TOU plans generally require a smart meter or time-interval meter so the utility can record when consumption occurs. If your home does not yet have one, your utility may need to install it before you can enroll.
TOU tends to benefit households that have genuine flexibility: those who can run dishwashers, washing machines, and EV chargers outside peak windows. Fixed schedules, work-from-home setups that concentrate daytime usage, or households with medical equipment running continuously may find TOU less advantageous.
| Flat-rate | Tiered | Time-of-use | |
|---|---|---|---|
| Price per kWh | Fixed, always the same | Rises as monthly usage increases | Varies by time of day |
| Bill predictability | High | Moderate | Lower without planning |
| Rewards off-peak use | No | No | Yes |
| Penalizes high volume | No | Yes, above tier threshold | No, if shifted off-peak |
| Smart meter required | Usually no | Usually no | Often yes |
| Best usage pattern | Steady, moderate use | Low to moderate use | Flexible scheduling possible |
| Switching complexity | Baseline, often default | Low | Moderate, meter may be needed |
How to compare your options practically
The comparison table above outlines the structural differences, but the dollar impact depends on your specific usage profile. Your utility bill or online account portal typically shows your monthly kWh consumption. Pulling 12 months of data smooths out seasonal swings and gives you a realistic baseline.
With that data, you can ask your utility for a bill comparison tool, which many now provide. These tools apply each available rate structure to your actual usage history and show an estimated annual cost under each plan. Some utilities also offer rate advisors by phone.
When reviewing TOU options, look at the specific peak and off-peak windows and compare them honestly against your household routine. If peak hours run from 4 p.m. to 9 p.m. and your household is home and active during that window, the flexibility needed to shift usage may be limited. See our room-by-room breakdown of what drives utility costs for a closer look at which appliances consume the most energy and when.
For households exploring other usage-based pricing models in different service categories, usage-based auto insurance programs follow a similar logic: your behavior during certain conditions affects what you pay.
Check for seasonal rate variations
Some utilities adjust tier thresholds or TOU windows by season, charging more during summer peak months and less in winter. Before switching plans, confirm whether the rates shown apply year-round or change by season. A plan that looks favorable in winter could produce higher bills in summer if the peak window widens or the on-peak rate increases.